Descriptive Intervention Analysis
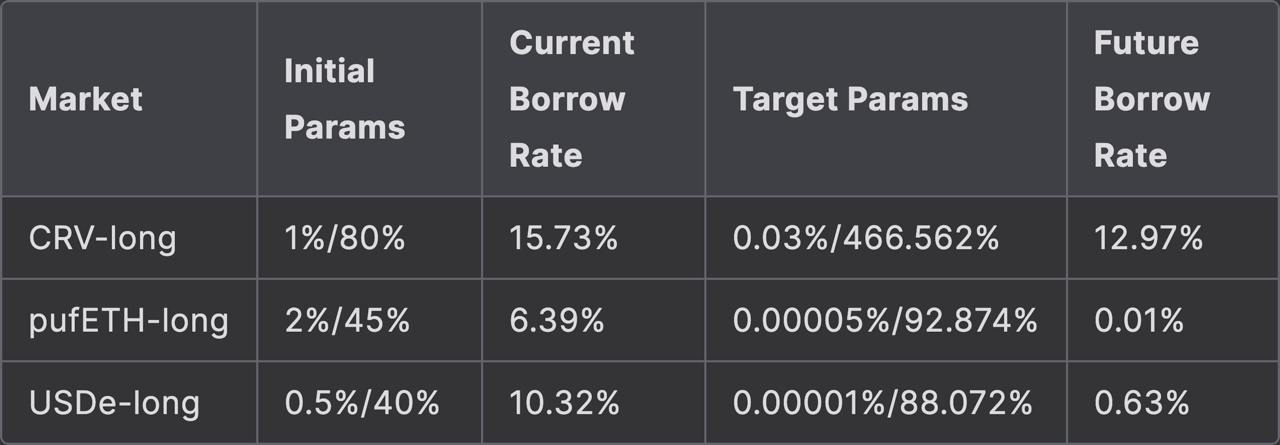
On February 19, 2025, key adjustments to Semilog Monetary Policy parameters —CRV-long, USDe-long, and pufETH-long—were implemented following our recent governance proposal.
These changes aimed to enhance capital efficiency and risk-adjusted returns within the system. This report provides a descriptive breakdown of the impact of the policy modifications so far.
We look at the key metrics of the performance marker of LlamaLend Markets - these include: Lend/Borrow APY, Utilization, Debt and Total Asset, Number of Loans and Collateral Ratio for each market.
For context we provide in each chart the:
-
Announcement Date (2025-02-09, gray dashed line): Governance proposal published.
-
Treatment Date (2025-02-19, red dashed line): where parameter changes of the SemilogMP took effect.
The rational for this is to give an idea of proactive and reactive behavior to the policy change.
Note: The analysis is this document is purely descriptive. We do not make any causal inference, due to lack of counterfactuals. We working on methods for causal inference, yet as always isolating effects in empirical data is notoriously difficult.
Analysis By Market
CRV-long Analysis
CRV-long Analysis
This section provides a descriptive breakdown of CRV-long market conditions surrounding the policy changes that took effect on February 19, 2025. Each section contextualizes key market dynamics before and after the intervention.
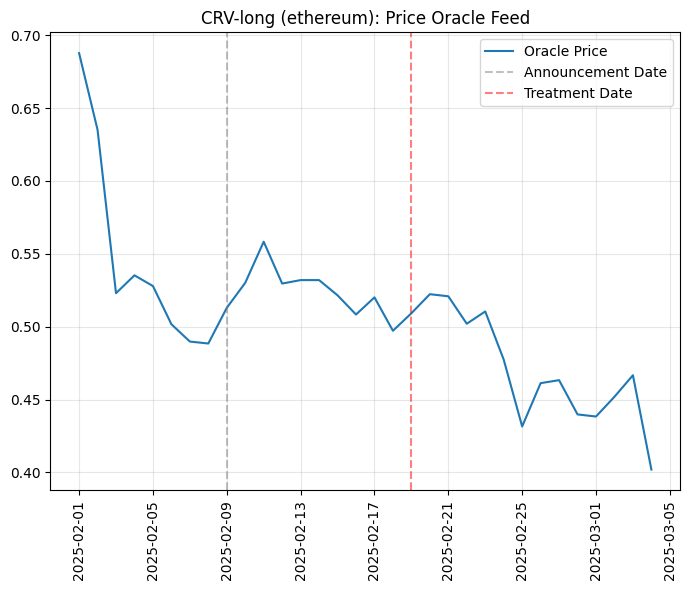
Price Oracle
The chart below tracks the daily price of CRV-long from the pool’s oracle feed, providing context on the price action for CRV.
Before the announcement date on February 9, the price of CRV experienced a clear downward trend. Between the announcement and the treatment date on February 19, the price temporarily stabilized, though fluctuations remained. After the treatment date, the price continued to decline, suggesting that external market conditions played a significant role in price movements. This chart serves as a reference for understanding market conditions during the policy transition and should be considered when interpreting the following analysis.
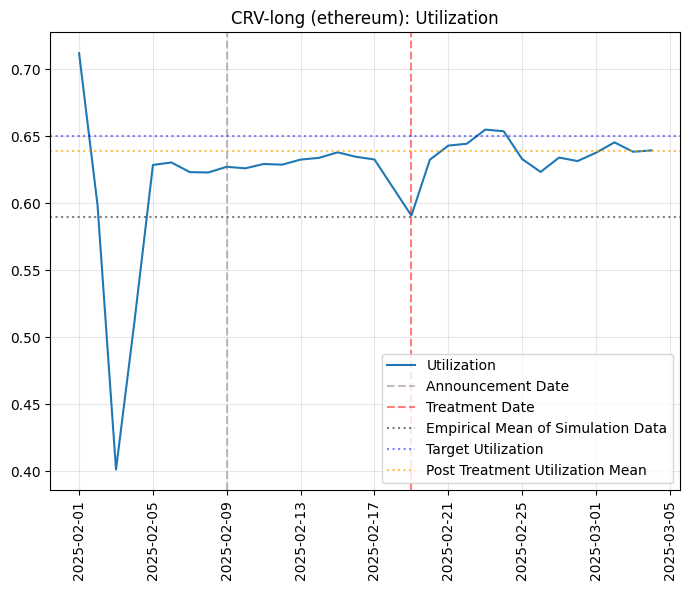
Utilization
The chart below shows the utilization of the CRV-long market. For additional context, we include the empirical mean of the simulation data, representing the observed data used to parameterize the simulation, the target utilization, which identifies the optimal utilization for the CRV-long market, and the post-treatment utilization mean, which reflects the empirical mean utilization after the treatment date.
Utilization after treatment moved closer to the target utilization compared to the empirical mean of the simulation data. Prior to the intervention, utilization had already shown signs of stabilizing, briefly dipping before the treatment date, then recovering and settling at a slightly higher mean of 0.64. The market appears to be effectively targeting the ideal utilization level, though further observations may be necessary to confirm long-term stability.
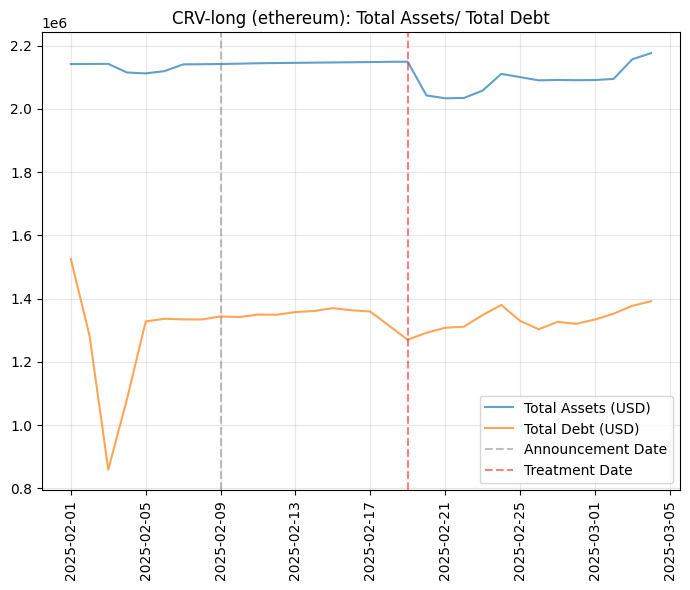
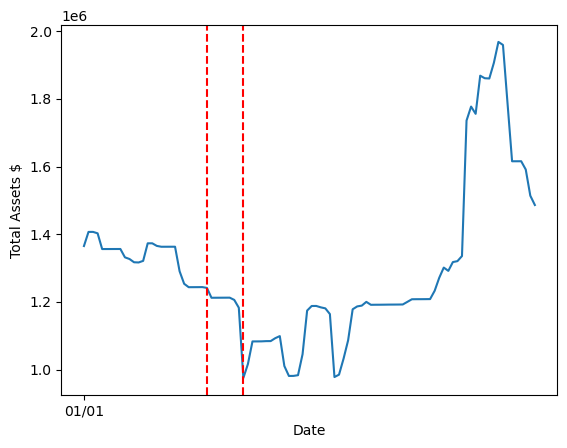
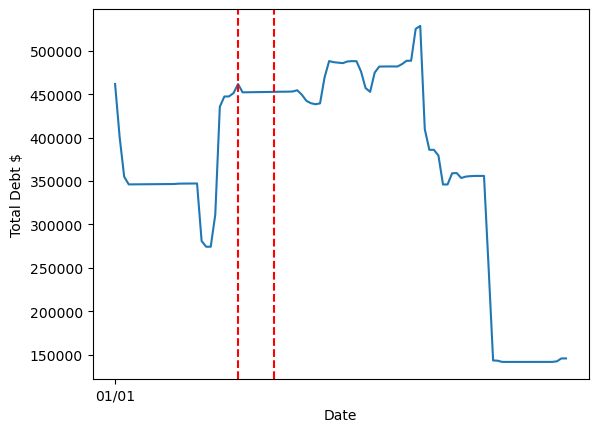
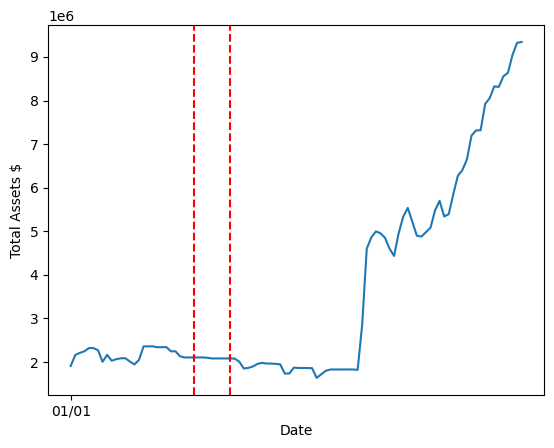
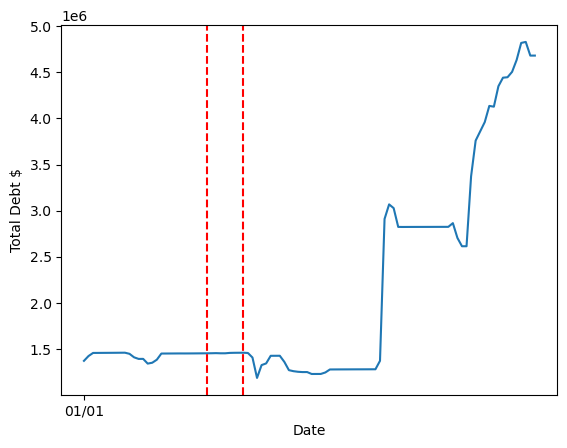
Total Debt and Total Assets (USD)
The chart below shows the Total Debt and Total Assets in the CRV-long market. Since utilization is defined as the ratio of Total Debt to Total Assets, this chart helps explain the observed utilization changes.
A decline in Total Assets occurred a day after the announcement, suggesting that some suppliers withdrew their deposited crvUSD. This aligns with expectations, as suppliers under the new policy received lower compensation. Around the treatment date, debt also declined, likely due to borrowers repaying positions in response to the CRV price drop. However, past the treatment date, both supply and borrowing demand rebounded. These movements suggest that while the intervention may have influenced initial liquidity behavior, broader market conditions also played a role.
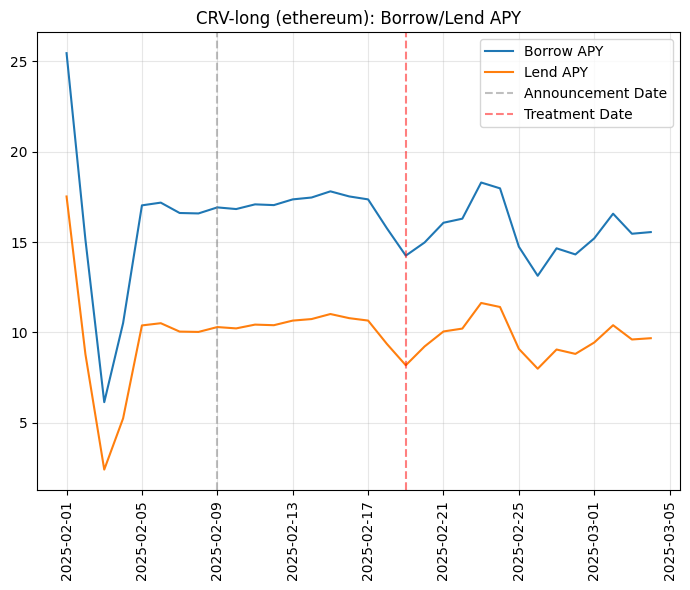
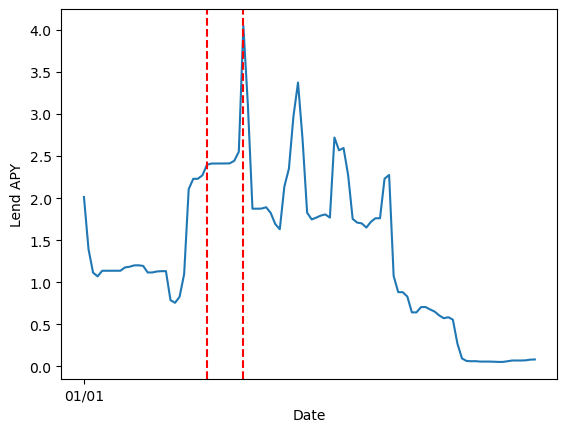
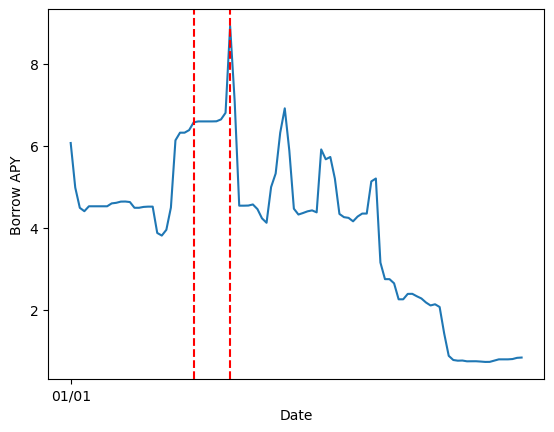
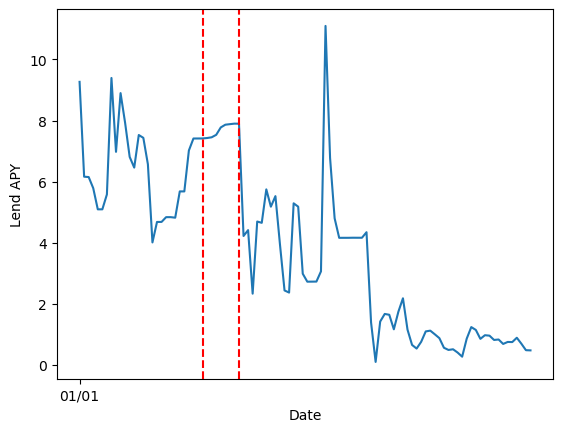
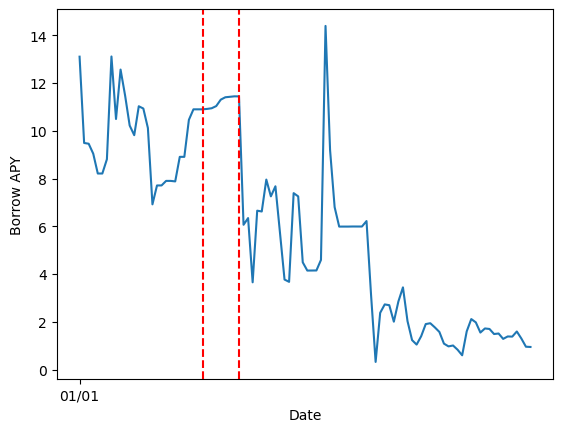
Borrow and Lend APY
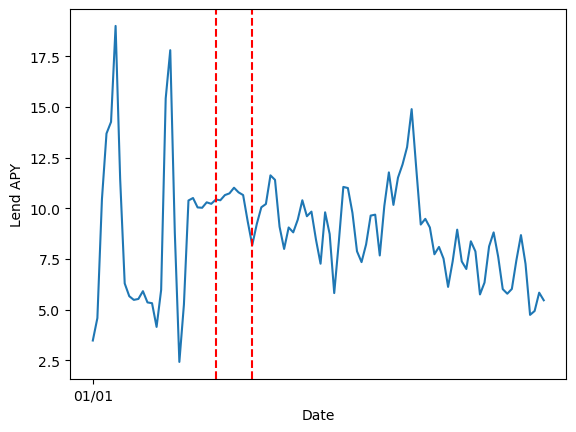
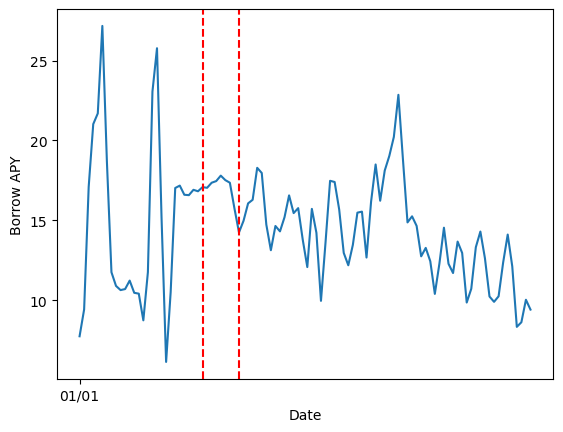
The chart below presents the Borrow and Lend APY for CRV-long.
Both borrow and lend APY declined around the treatment date, which aligns with expectations that adjustments in monetary policy parameters.
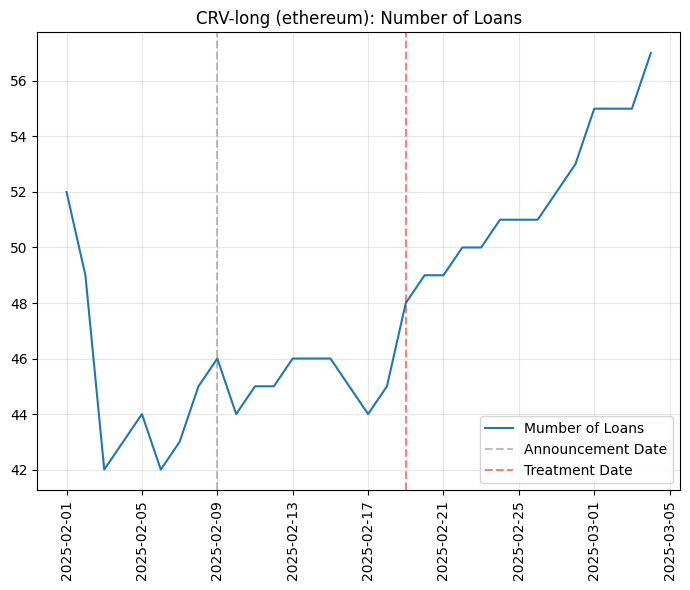
Number of Loans
The chart below depicts the number of loans in the CRV-long market.
The number of loans increased both shortly before and after the treatment date. It is unclear whether this was directly caused by the intervention itself or by other market forces. Borrowers may have anticipated lower borrowing costs, leading to increased demand, or the overall market environment may have encouraged more borrowing. Specifically, declining crypto prices could have led traders to take positions in expectation of a market recovery. While the trend is notable, further data collection is needed to determine causality.
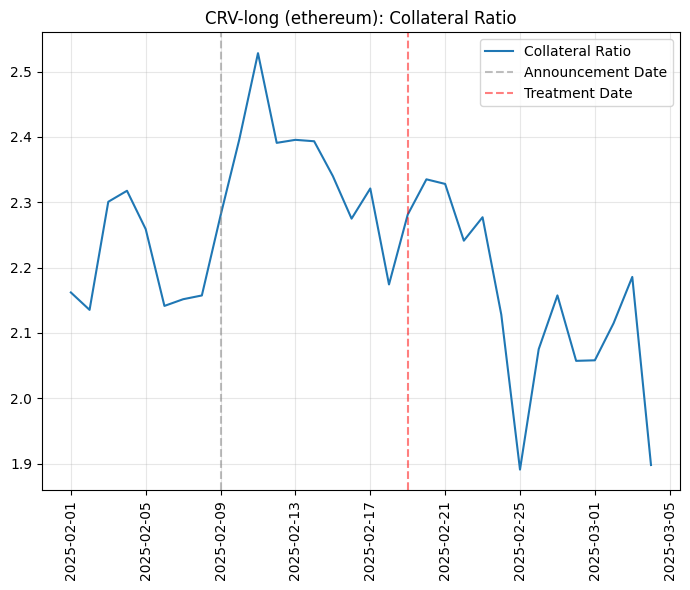
Collateral Ratio
The chart below shows the collateral ratio for CRV-long.
In line with CRV’s depreciation, the collateral ratio worsened after the treatment date. However, borrowers remain well over-collateralized on average, which aligns with expectations given the volatility of CRV.
pufETH-long Analysis
pufETH-long Analysis
This report provides a descriptive breakdown of pufETH-long market conditions surrounding the policy changes that took effect on February 19, 2025. Each section contextualizes key market dynamics before and after the intervention.
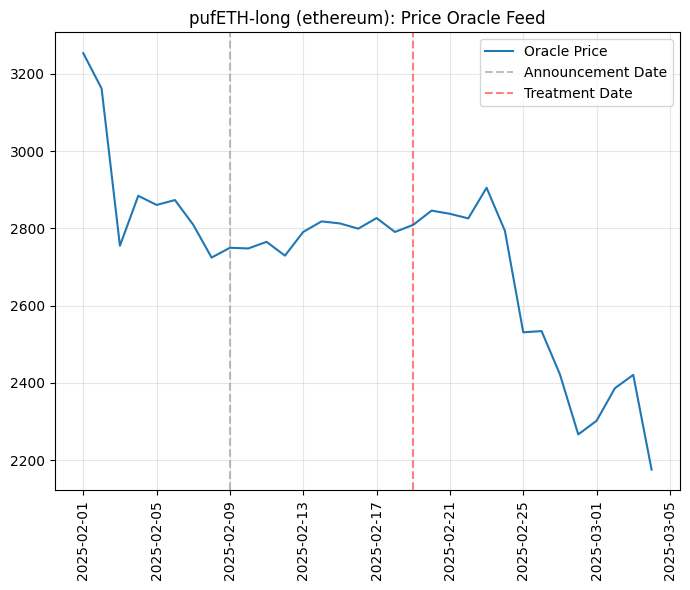
Price Oracle
The chart below tracks the daily price of pufETH-long from the pool’s oracle feed, providing context on the price action for pufETH.
Prior to the announcement date on February 9, the price exhibits experience a decline dropping the price from 3200 USD to 2800. Between the announcement date and the treatment date on February 19, prices remain relatively stable before experiencing a slight shift in direction. After the treatment date, there is an observable change in price.
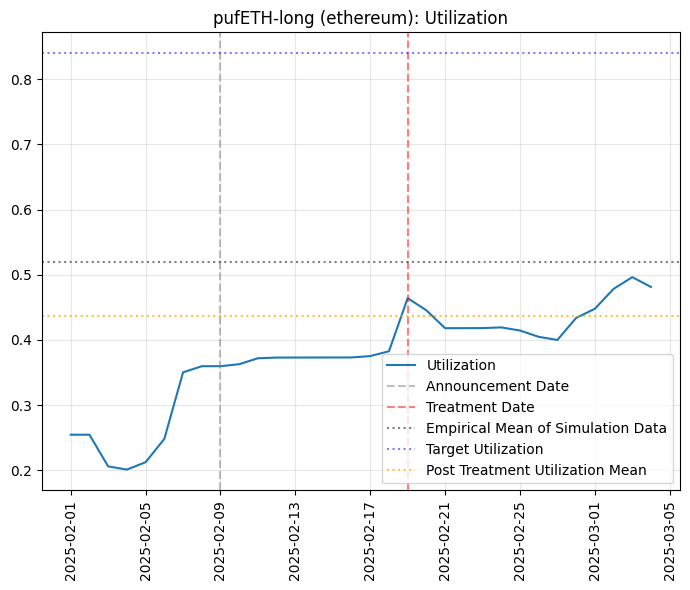
Utilization
The chart below shows the utilization of the pufETH-long market. Utilization is defined as the ratio of total debt to total assets, and understanding its behavior is key to assessing lending dynamics.
Leading up to the treatment date, utilization appears to below the Empirical Mean of the Simulation Data, yet climbing to around 0.4 prior to the treatment date. After the policy took effect, utilization seems to move closer to an target utilization. Yet, it is still far from optimal levels at 0.84. Given the pre-trend in utilization dynamics it is very hard to explain whether policy change contributed.
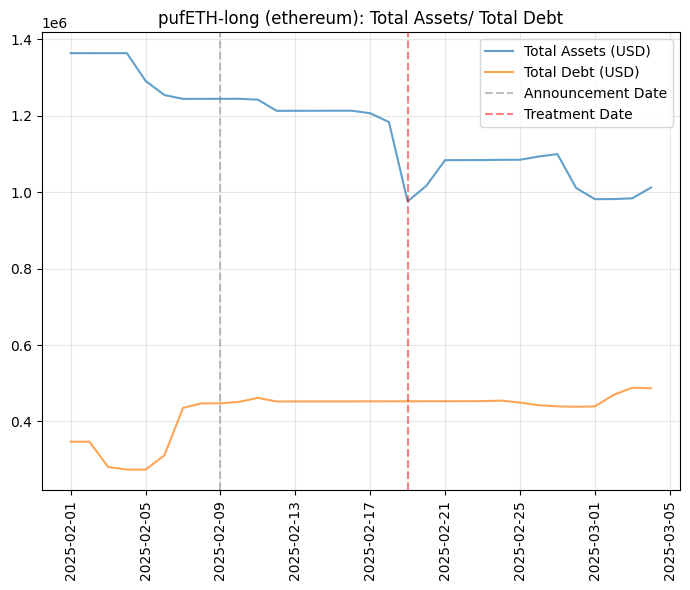
Total Debt and Total Assets (USD)
The chart below shows total debt and total assets in the pufETH-long market. Since utilization is the ratio of these two metrics, examining them helps clarify recent changes in utilization.
Following the announcement date, a reduction in total assets can be observed, potentially indicating that some suppliers withdrew funds or redeployed them elsewhere. Around the treatment date, total assets dipped, which may align with participants withdrawing asset due to a reduce Lend APY. Total Debt effectively remained unchanged. This allows us to infer that the Utilization increase is due to supplier withdrawing crvUSD.
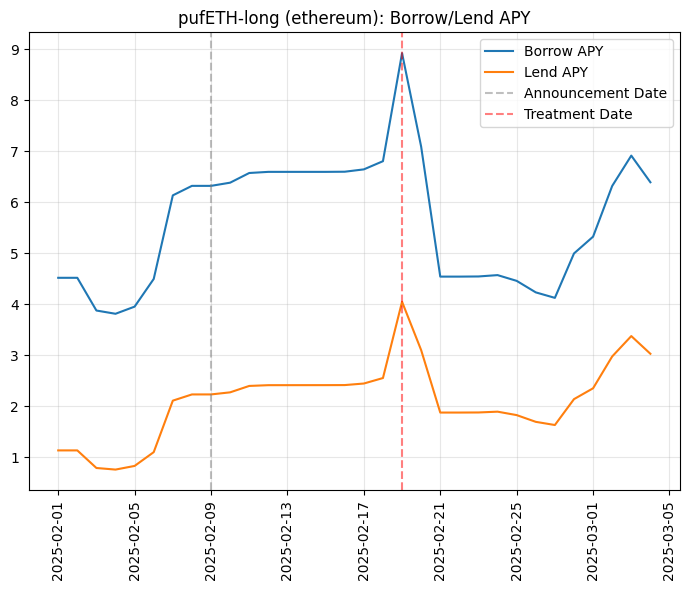
Borrow and Lend APY
The following chart presents the borrow and lend APY for pufETH-long.
As anticipated, both the borrow rate and the lend rate dropped on the intervention date.
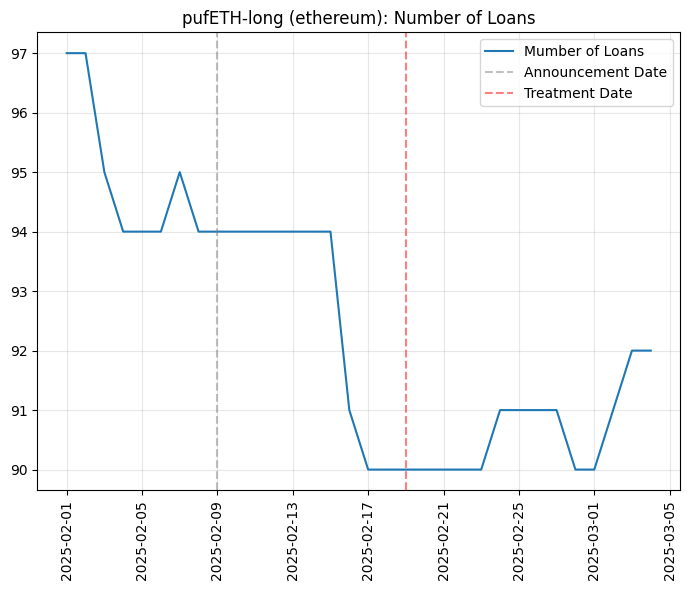
Number of Loans
The chart below depicts the number of loans in the pufETH-long market.
A decline in the number of loans is visible prior to the the treatment date. After, we see a slight increase again. However, it remains uncertain whether this uptick reflects expectations of cheaper borrowing, other market catalysts, or a combination of both. A longer observation window could clarify if this elevated loan demand persists and whether it correlates directly with the new policy parameters or with exogenous market factors.
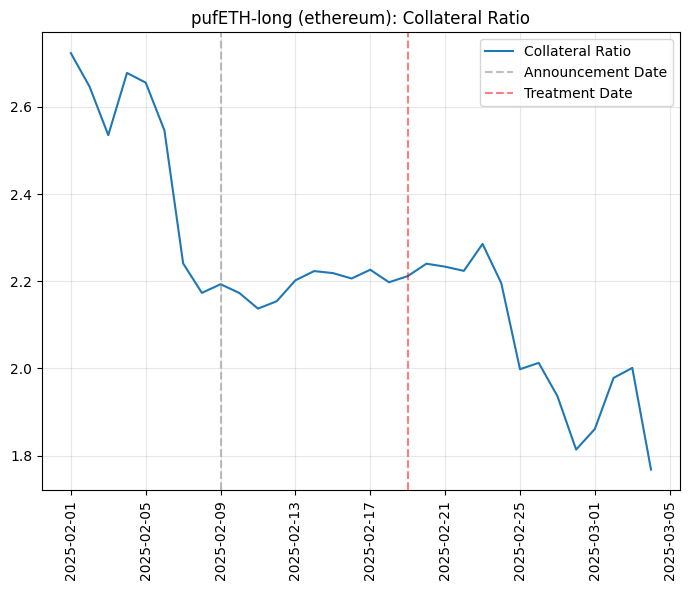
Collateral Ratio
The chart below shows the collateral ratio for pufETH-long.
Following the treatment date, the collateral ratio experiences some fluctuations that mirror pufETH price changes. While the ratio may have worsened slightly due to a dip in underlying asset value, borrowers appear to remain sufficiently collateralized overall. This suggests a degree of prudent risk management by market participants, who are likely mindful of the volatility associated with pufETH.
USDe-long Analysis
USDe-long Analysis
This report provides a descriptive breakdown of the USDe-long market surrounding the policy changes that took effect on February 19, 2025. Each section contextualizes key market dynamics before and after the intervention.
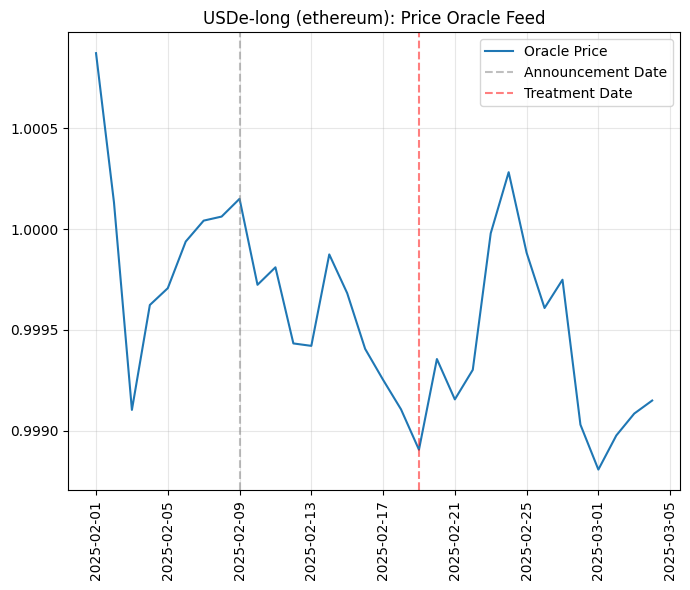
Price Oracle
The chart above illustrates the daily price of USDe-long. The price largely trades close to the 1 dollar peg.
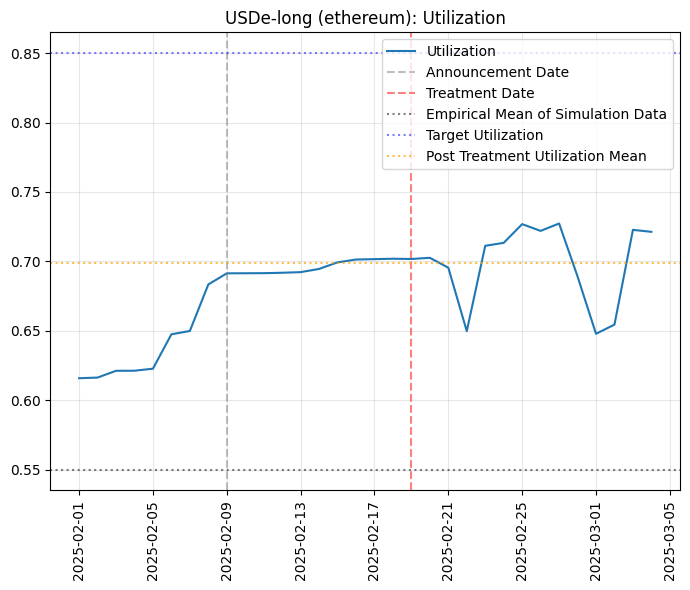
Utilization
The utilization chart shows the ratio of total debt to total assets in the USDe-long market. Prior to intervention, utilization appears to be slightly on a growing trend. Post-treatment, utilization seems to remain within the same general range, yet reflecting more volatility.
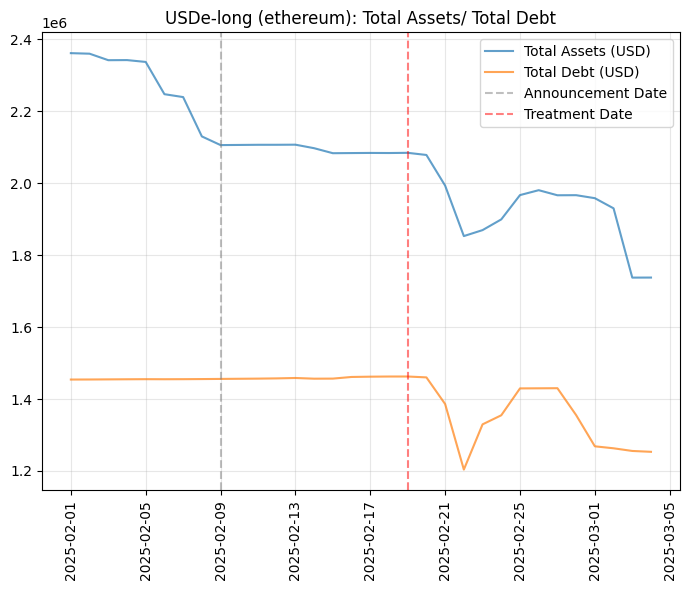
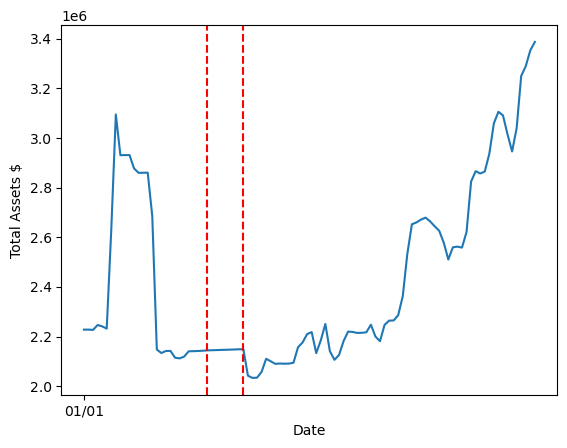
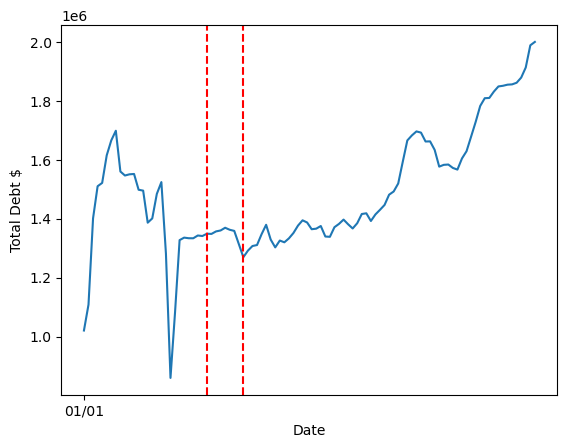
Total Debt and Total Assets (USD)
Examining the total debt and total assets provides insights into changes in market participation. Overall, we see a trend of declining total assets. Prior to the treatment, this largely aligns with a decreased crvUSD supply. The trend continues post-treatment period. Total debt experiences further decline after the treatment date whereas it had been previously stable.
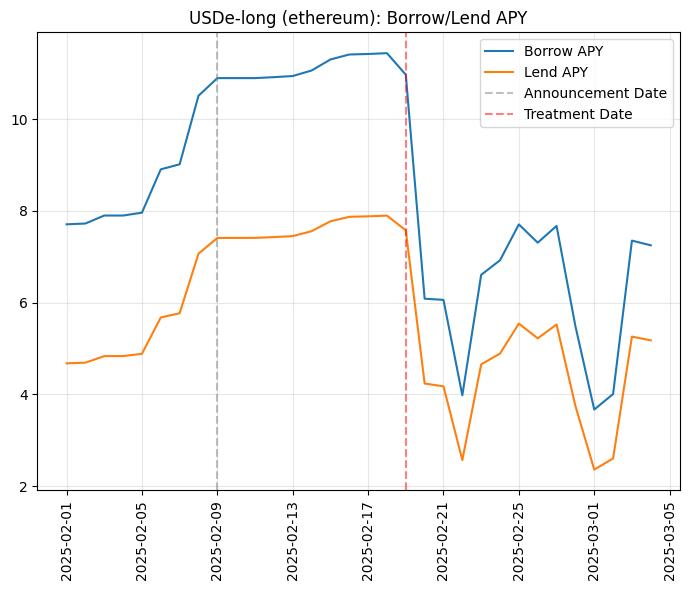
Borrow and Lend APY
In the chart illustrating borrow and lend APY, a decline around the treatment date is noticeable as anticipate.
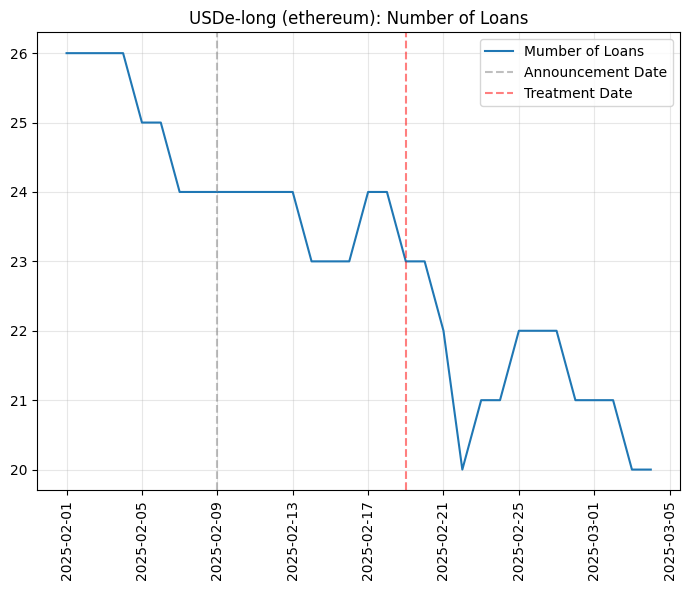
Number of Loans
The number of loans shows a general decreasing trend starting pre-treatment and continuing post-treatment. Additional data and more in-depth analysis would help clarify the relationship between loan demand and the new parameters.
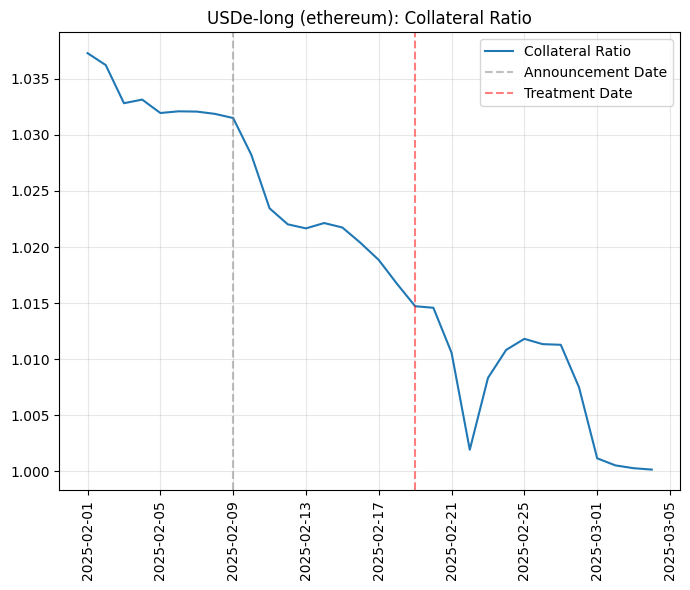
Collateral Ratio
As with most collateralized lending markets, the collateral ratio reflects the extent to which loans are secured by collateral backing. Collateral Ratio worsens, likely due to a divergence in the USDe and crvUSD price.
Conclusion
Across CRV-long, pufETH-long, and USDe-long, no immediate disruptions or adverse outcomes are evident following the February 19, 2025 policy changes. Key indicators—such as utilization, total assets, total debt, and APYs—altered in ways that are generally consistent with expectations, but also reflect broader market forces. While utilization in each market moved closer to intended targets or remained stable, borrow and lend rates showed modest declines around the treatment date, suggesting that the intervention had at least some short-term influence.
However, it remains difficult to distinguish the policy’s direct impact from external factors without a more detailed, counterfactual-based analysis. In all three markets, participants generally stayed well-collateralized, and any shifts in supply or loan activity appear manageable within normal market volatility. As a result, the reforms show no signs of causing harm, yet further data collection and more analysis are necessary to determine whether the observed trends persist and truly fulfill the policy’s long-term goals.