Overview
Xenophon Labs has been awarded a research grant by Llama Risk and the Curve Research team to develop quantitative metrics for detecting stable asset depegs. We have designed and tested metrics that might present leading indicators for whether a stablecoin or liquid staking derivative will lose its peg. This research is a first step towards protecting Curve’s liquidity providers from depegs in LP’d assets. We look forward to feedback from Curve’s liquidity providers, whether they might find this research useful, and how we may continue to contribute to Curve’s ecosystem. This forum post is modified from our substack post here, and from our research paper here.
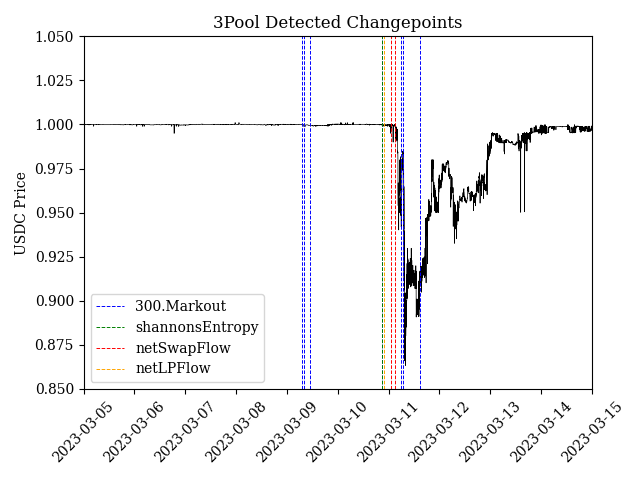
Caption: Detected changepoints using various metrics for the 3pool during the collapse of Silicon Valley Bank. The corresponding BOCD model was trained on 2022 UST Wormhole MetaPool data. The first changepoints are detected using the Markout metric on March 9th. All metrics emit changepoint alerts several hours before USDC dips below 99 cents, with the earliest at 9pm UTC on March 10th. For reference, USDC first dips below 99 cents at approximately 2am UTC on March 11th 2023 according to Chainlink oracles.
Research tl;dr
We look to protect Curve’s liquidity providers from stablecoin or liquid staking derivative (LSD) depegs by alerting them of potential depegs before they happen . To that end, Xenophon Labs has developed a suite of time series metrics that capture changes in order flow and market prices using on-chain data and CEX/DEX prices. We validate whether these metrics are useful leading indicators of token depegs using a Bayesian online changepoint detection (BOCD) model. We show that our BOCD model, trained on 2022 UST metrics, successfully detects the March 2023 USDC depeg approximately 5 hours prior to prices falling under 99 cents.
Our BOCD models detect abrupt changes in our time series metrics. We have found two particularly strong metrics in detecting depegs:
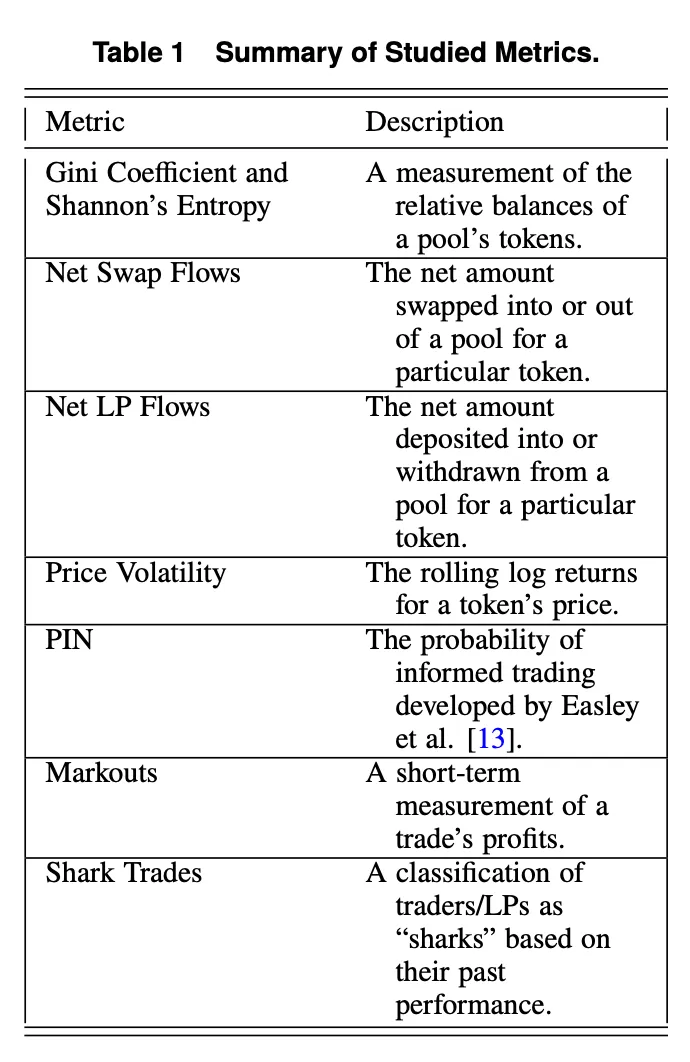
- Shannon’s Entropy: a measure of the share each token has in the pool (e.g. how much of the 3pool is USDC vs DAI vs USDT?)
- Net Swap Flow: the net amount of tokens being swapped into or out of the pool over some period (e.g. 1 hour).
We conclude that abrupt changes in the above metrics tend to precede changes in market prices for tokens in major StableSwap pools such as the 3pool, ETH/stETH, and FRAX/USDC, sometimes by several hours. Our trained and tested models are online and can be listened to by following this Twitter bot.
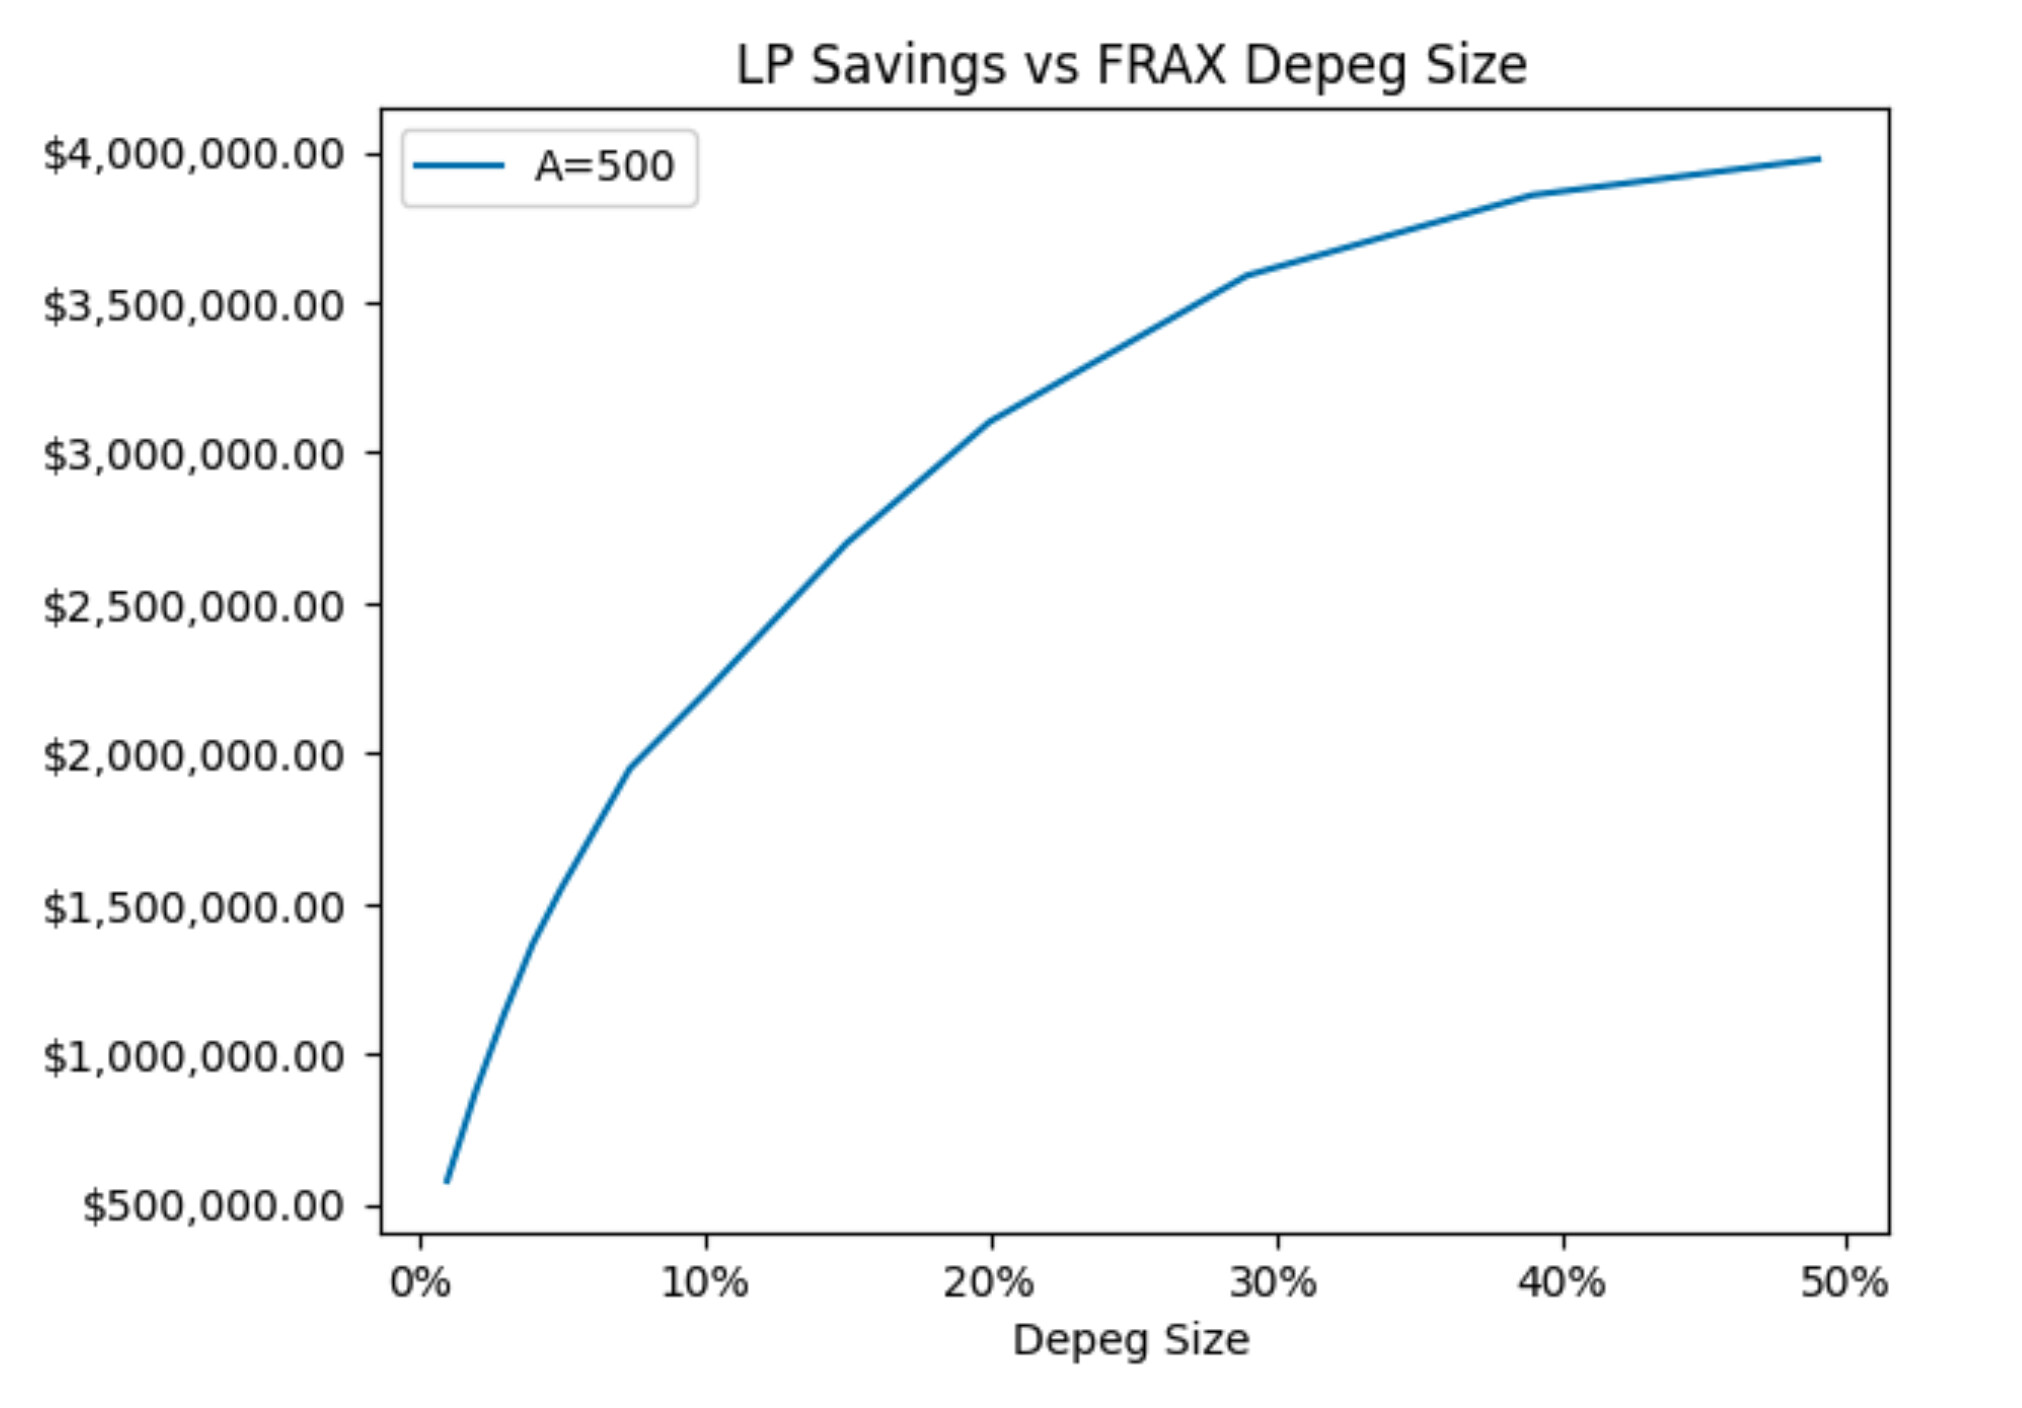
We discuss how LPs might leverage these alerts to de-risk their Curve positions, how our API may be used to integrate with Curve analytics dashboards, and how this research could be extended to perform dynamic parameter updates on Curve pools, such as lowering the A parameter to protect LPs.
Metrics
We developed several metrics in hopes of creating leading indicators for token depegs.
We picked/constructed these metrics based on two key premises:
- They have some stable or equilibrium value over time.
- Deviations from this equilibrium indicate/correlate with potential depegs.
For example, we expect the hourly net swap flow into or out of a pool to generally hover around 0 in order to maintain a balance in pool prices. If there is a rush to swap into or out of a specific token, it is likely that the market has new information on the tokens’ true prices.
Similarly, we expect relative token balances in a pool to be stable over time: if the pool suddenly becomes imbalanced it is very likely the market has new information on the relative value of the tokens in that pool.
Modeling
We then trained a Bayesian inference model on top of each metric to determine which metrics are actually useful for our purposes. BOCD models have certain hyperparameters, such as the prior parameters for the chosen probability distribution. We determined these hyperparameters using UST Wormhole pool data from January 2022 to June 2022.
Bayesian online changepoint detection models work by keeping track of a run-length, r_t : the number of time steps since the last changepoint. The model will assign a probability to each possible run length P(r_t) , and at each time step we keep track of the most probable run-length. If the most probable run length in the following timestep is not equal to 1 plus the previous run-length, then we assume this indicates a changepoint .
The model assigns probabilities to run-lengths using Bayes’ theorem. We assume some prior probability distribution for our time series (in our case a Student’s t-distribution), and test the hypothesis that a new datum x_{t+1} originates from the same probability distribution as the previously observed data points x_{t-l:t} , where l is the run-length being tested.
We used BOCD models for our purposes for two reasons:
- They are simple, both in terms of understanding and implementation.
- They are “online”, meaning they are designed to perform inference with every new datum that becomes available.
Results
We found promising results for Curve’s largest StableSwap pools - meaning pools with high 24h volume and high TVL using our Entropy and Net Swap Flow metrics. In the figures below, we show that our metrics correlate strongly with high-information events, such as the collapses of UST, FTX, and Silicon Valley Bank (gray bars). For the SVB collapse in particular, our models detect a potential depeg on 3pool tokens at 9pm UTC on March 10th 2023, approximately 5 hours before priced dipped below 99 cents (according to Chainlink).
Notice the top graphs compare the LP Share Price and the Virtual Price of a pool. The former is the USD value of an LP token using the dot product of token balances and token prices, divided by the number of outstanding LP tokens. The latter is a unit-less measure of LP token value if all tokens in the pool were pegged. Their difference is therefore a measure of the aggregate “depeggedness” of the pool. Differences between these values of 5% or more are labeled as True Changepoints .
Large Pools
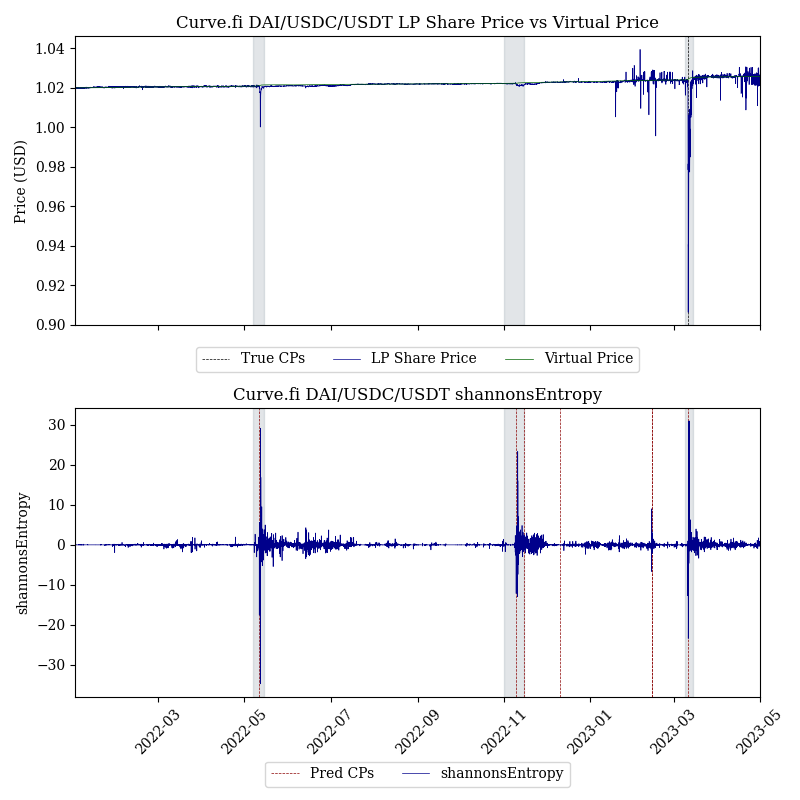
Caption: BOCD results using hourly log differences in Shannon’s Entropy for the 3pool. Our entropy model detects changepoints during the UST depeg, the FTX collapse, and the SVB bank run. The changepoint corresponding to the SVB collapse and the momentary depeg of USDC is detected at 9pm UTC on March 10th, hours before USDC dips below 99 cents. Notice how increased variance in entropy closely correlates with all three high-information events, illustrated with the gray bars. Since 3pool LP share prices did not meaningfully deteriorate during the UST and FTX events, the corresponding changepoints are flagged as false positives by our scoring rule, although they are still useful signals for LPs.
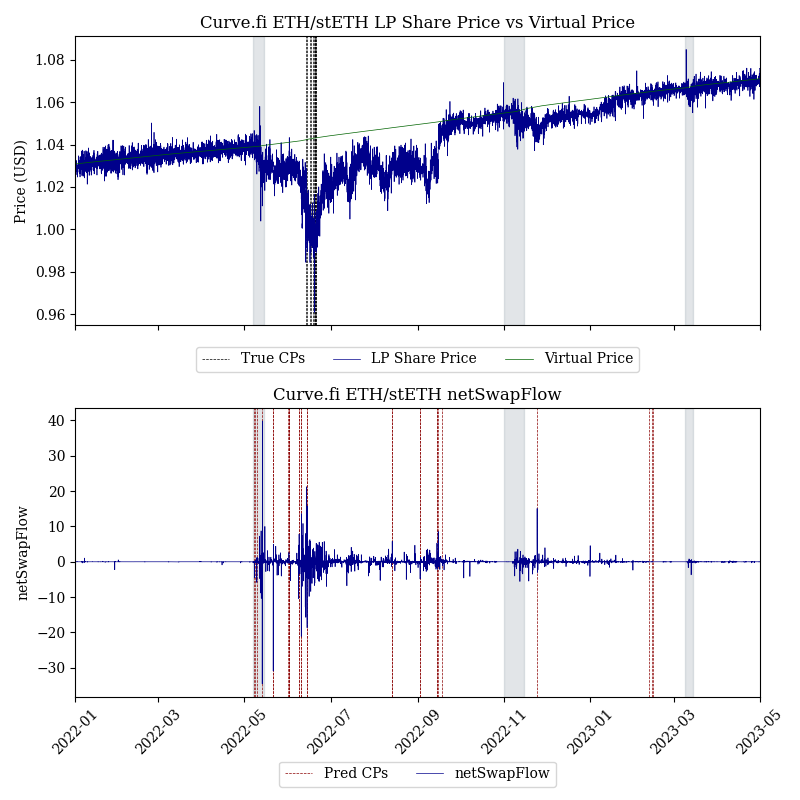
Caption: BOCD results for the net swap flow metric in the ETH/stETH pool. Notice how the LP share price on the ETH/stETH pool is below its “peg" (the virtual price) for several months in 2022. Accordingly, most metrics, including the netSwapFlow metric pictured here, detect several changepoints as stETH depegs and repegs to ETH between June and October of 2022. stETH first depegs from ETH around May 12th 2022, and depegs further around June 10th. The first depeg detected by our Swaps model occurs on May 8th 2022, when stETH is still around 0.99 ETH. The volatility during this period results in a number of depegs being detected by our models, although only the first detection provides useful leading information to liquidity providers.
Small Pools
Results are less promising for smaller pools, where individual trades and deposits/withdrawals may have much larger impacts in the underlying metrics, making them noisy.
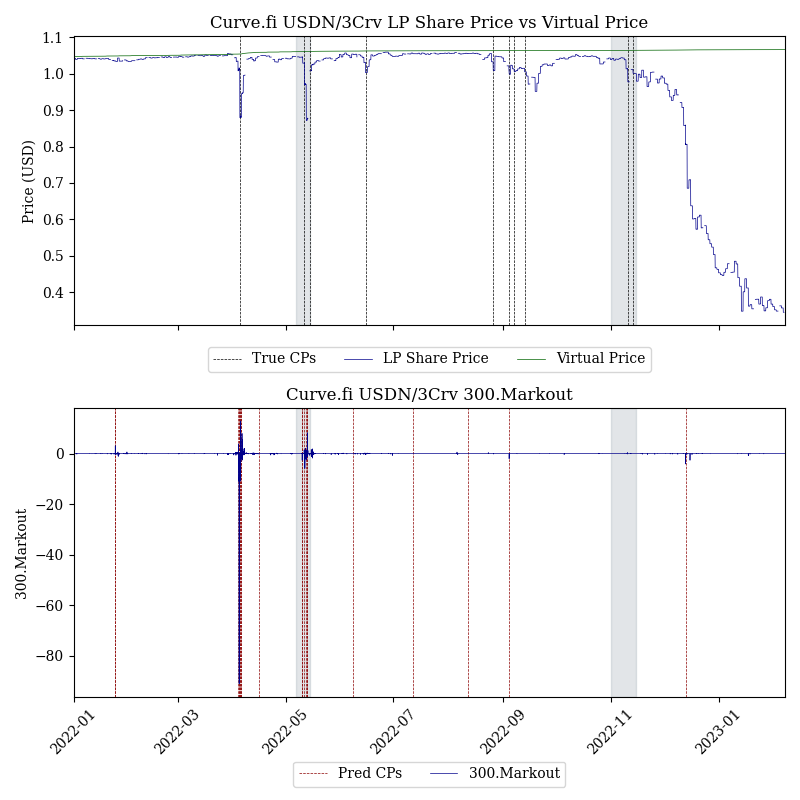
Caption: BOCD results for the markout metric in the USDN Metapool. Markout changepoint detections generally coincide with changes in the LP share price relative to the virtual price, although none of the detections lead USDN price data. All models, including the markout model, become significantly noisier past June 2022, when the TVL and trading activity on the USDN pool declines significantly.
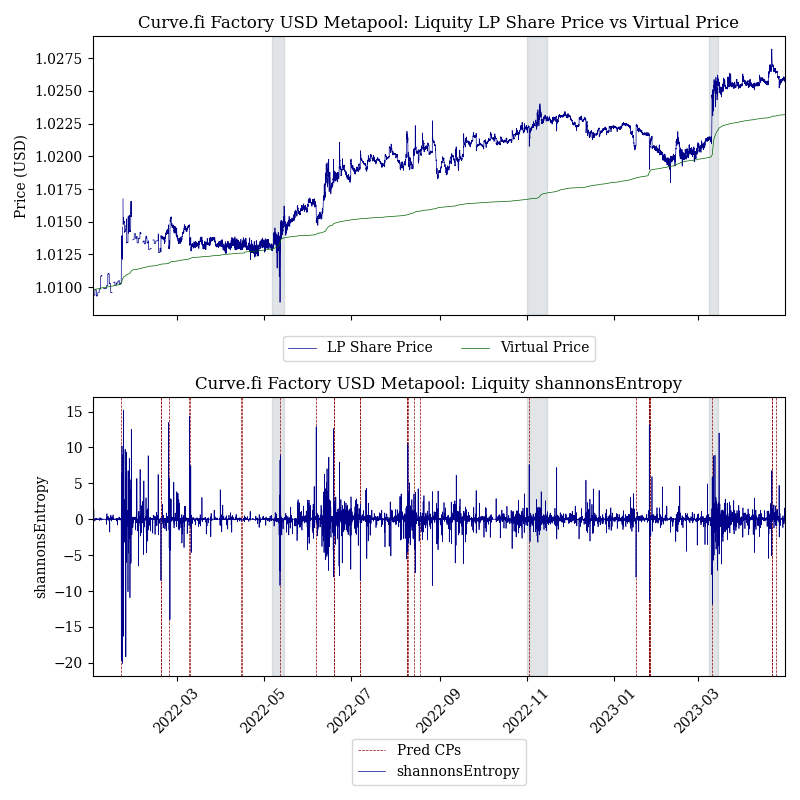
Caption: BOCD results for the entropy metric in the Liquity USD Metapool. As LUSD is a relatively small pool, individual swaps, deposits, and withdrawals have significant impact on pool composition, so both Entropy and Gini Coefficients are very noisy. Results for the LUSD pool generally represent the results on most smaller pools, such as the BUSD v1 metapool or the sUSD lending pool.
Conclusions
We have presented several metrics for detecting depegs on Curve’s stablecoins. We have designed and tested a Bayesian Online Changepoint Detection model using these metrics on 2022 and 2023 trading and pricing data, and identified 2 useful models for detecting depegs on Curve’s largest StableSwap pools. We have shown that these detection models often provide leading indicators of depegs by several hours, with some false positives in the 17 months on which they were tested. In this section, we describe how we believe this research may be leveraged by Curve LPs, and how we may extend our findings to better parameterize Curve pools.
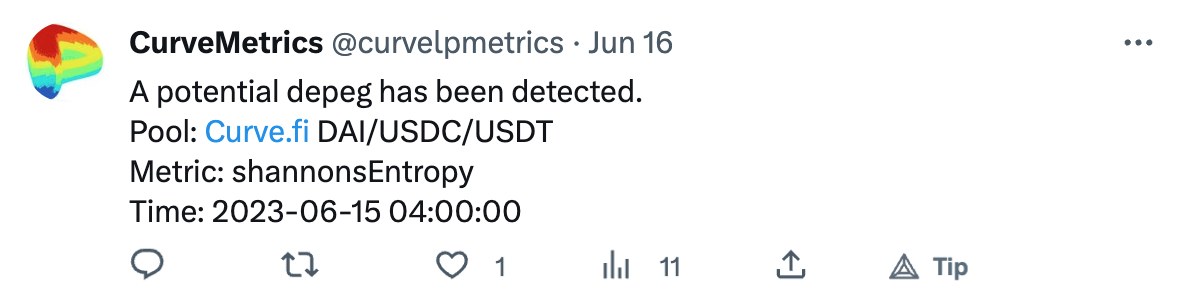
Alerting Bot
We have deployed a Twitter bot for LPs to listen to alerts regarding the pools they LP into. We are making these services available for large StableSwap pools, and we believe they might be particularly helpful to LPs who rebalance their portfolios on a discretionary basis. We aim to benefit Curve’s tokenholders, who are oftentimes LPs on large Curve pools, by providing them with as much useful real-time information as possible to make informed decisions. Furthermore, we hope that sophisticated Curve users might find the results in our paper interesting, and perform further research and development using our metrics or changepoint detection models for safer stablecoin liquidity provision. However, we do not recommend any LPs to naively integrate these alerts into their systems without performing their own backtesting. As discussed in our paper, providing liquidity during potential depegs may be profitable for LPs given the increase in swap activity, and depends largely on the LP’s risk appetite.
Analytics
All of our data, including metrics and detected changepoints, are available through our API. We hope this data will help develop and populate dashboards or other tools to inform Curve users on historical volatility for different pools, and highlight important historical depegs for further analysis. These metrics may be used in real-time in a variety of ways, not necessarily by implementing a Bayesian detection model. Furthermore, the real-time ranking of takers on Curve based on 1 day markouts are also available through our API, including their cumulative buys, sells, and trade count, as well as a query for identifying shark trades.
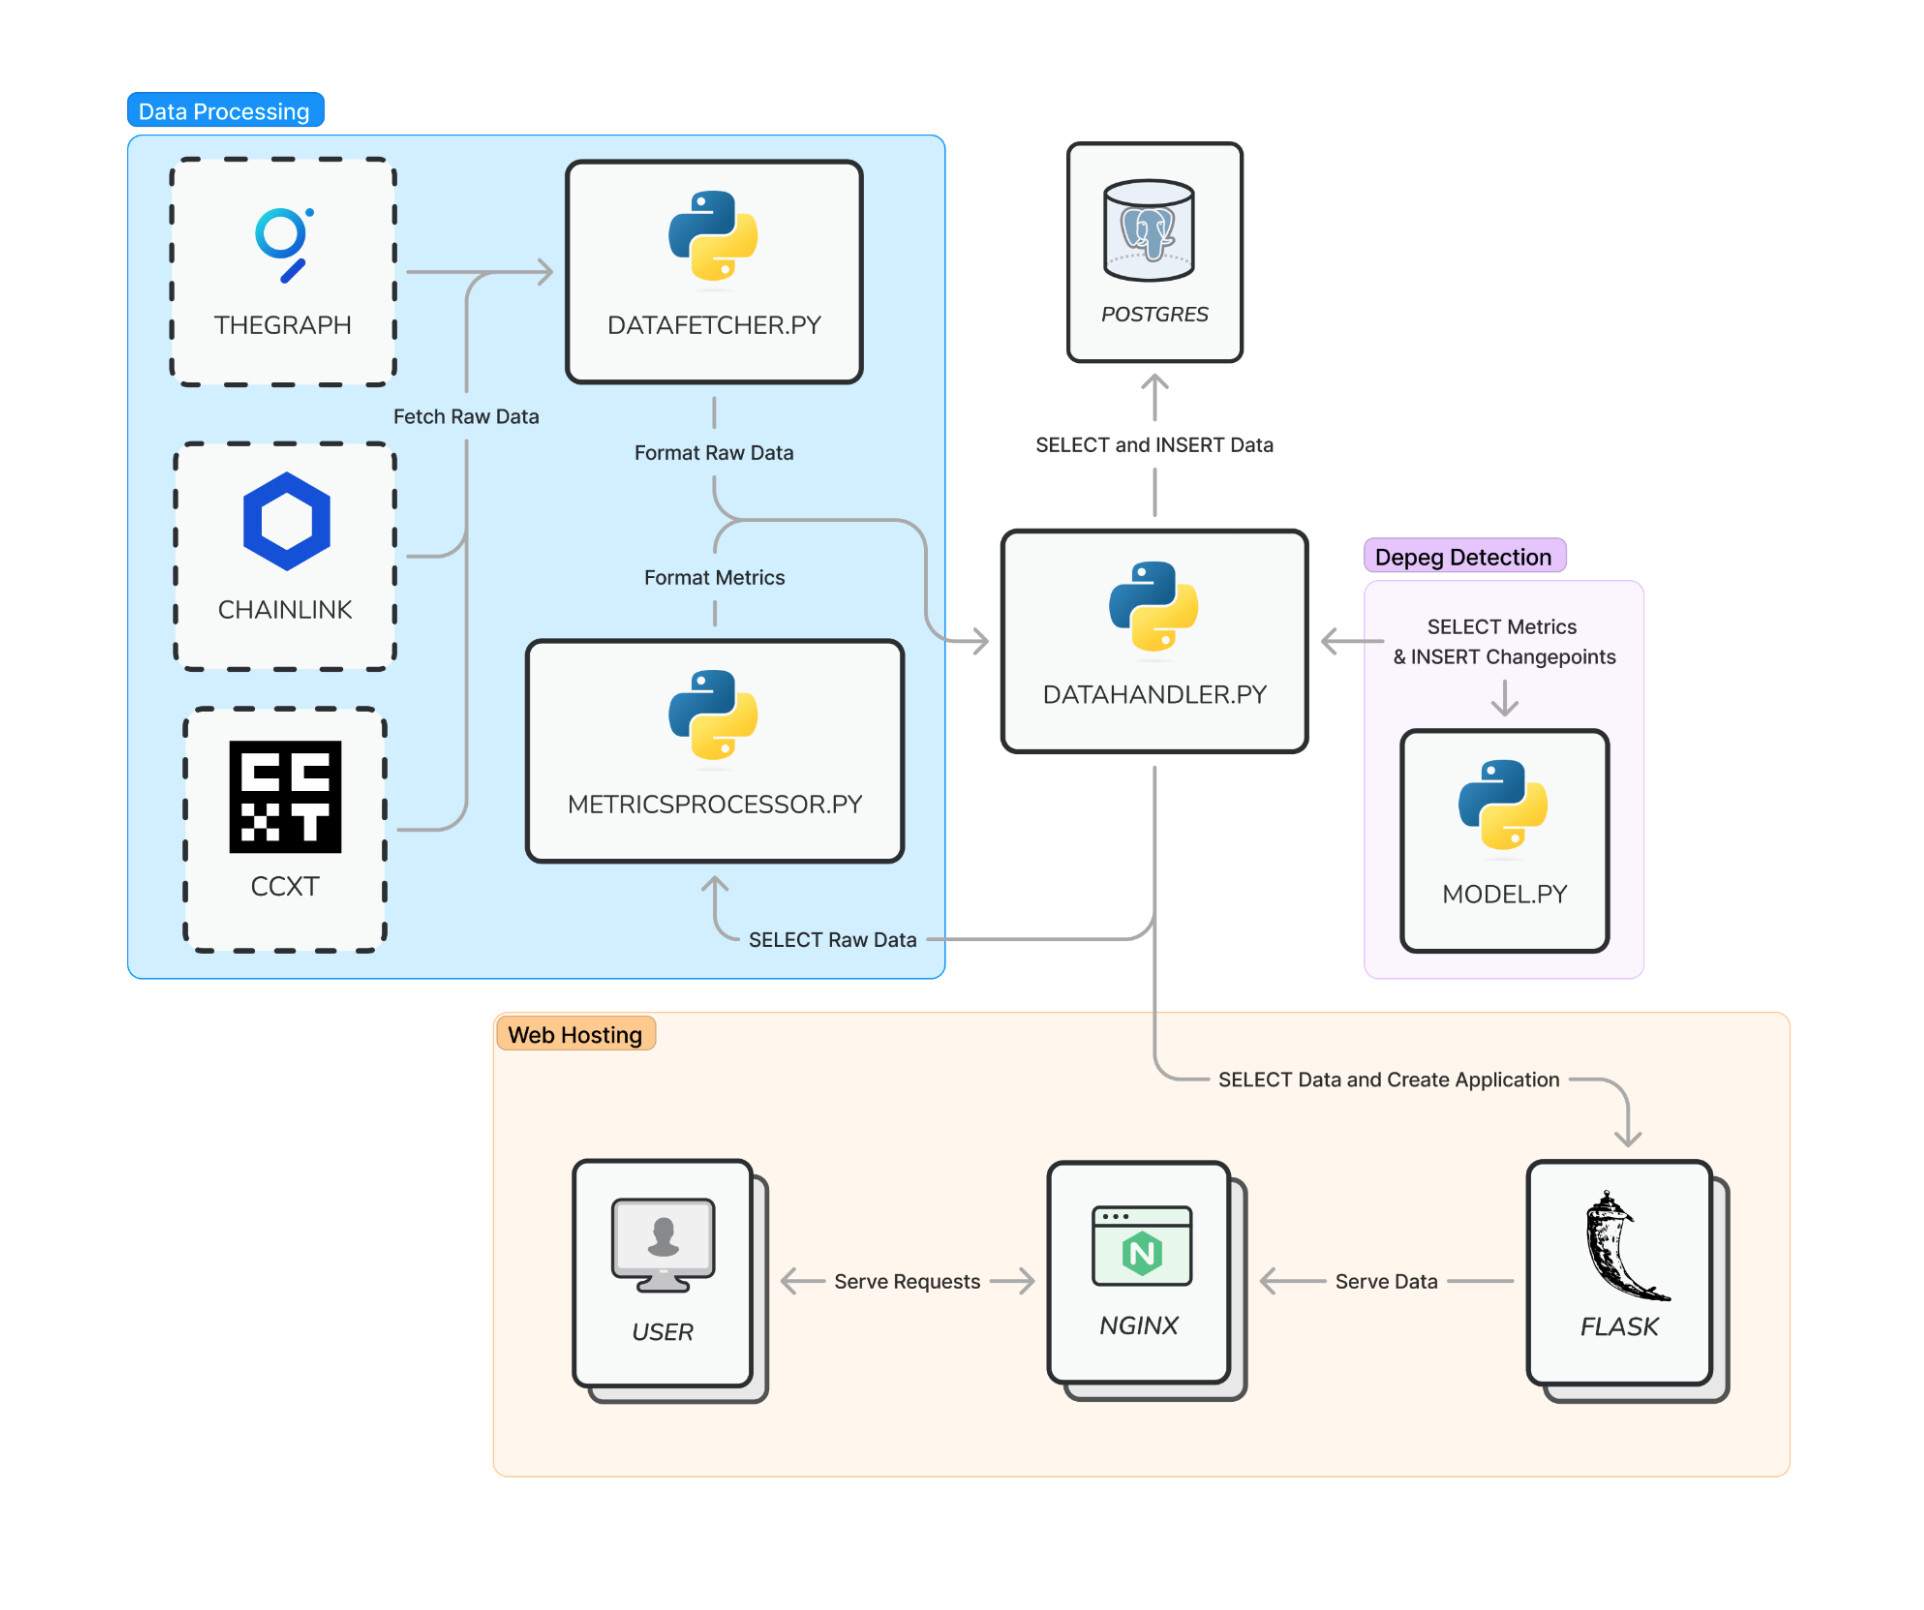
API Overview
Disclosure
The author(s) do not own CRV token, nor are they affiliated with Curve Finance or any of its affiliates. This research was funded by a grant from the Llama Risk and Curve Research teams. Any opinions or results stated here are those of the author(s), not of the Curve team or its affiliates. Any mention of “Curve” is in reference to the Curve Protocol, unless explicitly stated otherwise. Nothing in this post or our paper should be construed as financial advice or trading advice.