Summary
This proposal presents the results of an extensive parameter optimization study for a XAU/tBTC/WETH tricrypto pool. Our analysis leverages two complementary simulation frameworks - Curvesim and a specialized cryptopool-simulator - to ensure robust parameter selection across various market conditions. The combination of these tools provides both breadth and depth in our analysis, allowing us to validate our findings across different timeframes and market scenarios.
Analysis by @michwill (SwissStake) and Francesco (LlamaRisk)
Simulation Frameworks
Curvesim Analysis
Our initial analysis utilized Curvesim to explore the broad parameter space and understand fundamental relationships between key parameters. This initial phase was crucial for identifying promising regions in the parameter space before conducting more granular analysis. The simulation results shown below guided our subsequent detailed parameter optimization:
Cryptopool-simulator Deep Dive
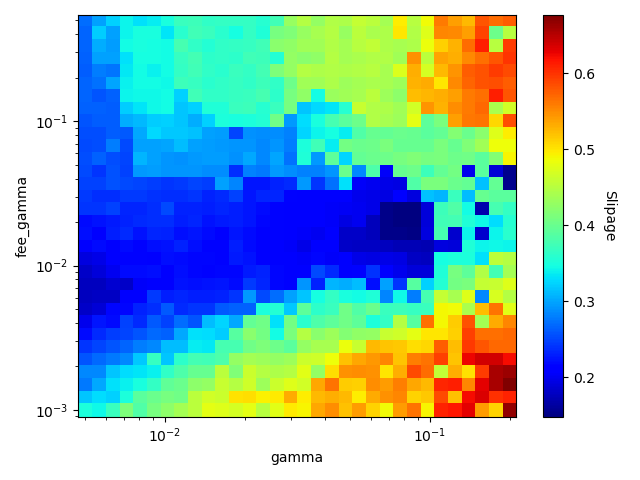
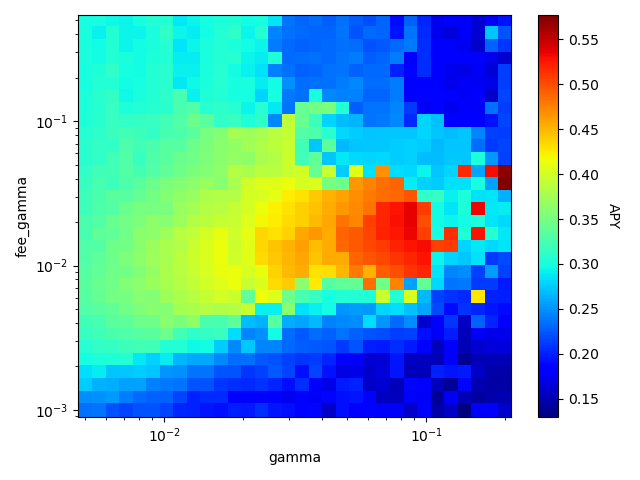
Following the broad exploration with Curvesim, we employed a specialized cryptopool-simulator for granular analysis using hourly candle data. This tool allowed us to examine parameter interactions in greater detail:

The heat map visualizes the intricate relationship between gamma and fee_gamma parameters, with darker blue regions indicating optimal performance areas. This detailed analysis helped refine our parameter selections within the promising regions identified by Curvesim.

The APY heat map further validates our parameter choices, showing optimal yield generation (darker red regions) aligning with our selected values.
Parameter Analysis and Justification
Amplification Coefficient Selection
The selection of A = 0.7 (a value of 189k as calculated by 3^3 * 10k * 0.7) emerged from thorough testing in both simulation environments. Curvesim results demonstrated optimal capital efficiency at this value, while cryptopool-simulator validation confirmed its stability under various market conditions. Lower values showed insufficient capital utilization during stable periods, while higher values introduced excessive volatility during market stress.
Dynamic Fee Structure
Our dual-simulation approach revealed the effectiveness of a three-tier fee system. The base fee (mid_fee) of 0.2% maintains consistent revenue during stable markets, while the outer fee (out_fee) of 1% provides protection during significant price deviations. The fee_gamma parameter of 0.021 optimally manages fee level transitions, as validated across both simulation frameworks.
Technical Specifications
Both simulation frameworks processed extensive historical data to validate parameter selections. Curve-sim provided broad validation across the broad parameters searcg space, while the cryptopool-simulator offered detailed insights into specific market scenarios. The combined results demonstrate robust pool behavior across multiple metrics.
The implementation requires setting the following parameters on deployment:
adjustment_step=1e-7,
fee_gamma=0.021,
ma_half_time=600,
mid_fee=0.002,
out_fee=0.01,
ext_fee=0.0003,
gamma=0.077,
A=0.7 (189000)
Conclusion
The proposed parameter set represents a carefully optimized configuration validated across two complementary simulation frameworks. The combination of Curve-sim’s broad analysis and cryptopool-simulator’s detailed validation provides strong confidence in parameter performance across various market conditions. The extensive testing process and comprehensive analysis of parameter interactions suggest these parameters will provide optimal performance for the XAU/tBTC/ETH pool while maintaining the high standards expected of Curve pools.
